In 2018 we sent out a questionnaire to get an idea of who our members are, and also find out what our members are grappling with specifically concerning equity, diversity and inclusion. We will be examining these responses over the next few newsletters. We got a number of very thoughtful responses, for which we are very grateful. However, our current sample size was relatively small at only 27 responses, so if you have not yet filled out our survey, we encourage you to take the time to do so. (Link here!!)
For our first write-up, we’re going to look at the basic demographic breakdown. Except for the breakdown by age and region, all other answers were self-identified by our respondents. Ed. Note: Larger versions of the graphs are in the gallery at the bottom of this page.
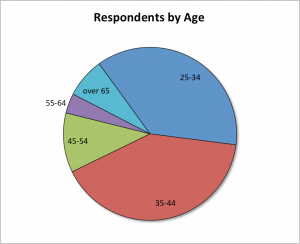
Our respondents’ age range was mostly divided between the 25-34 and 35-44 age range, with some respondents in the 45-54, 55-64 and over 65 range.
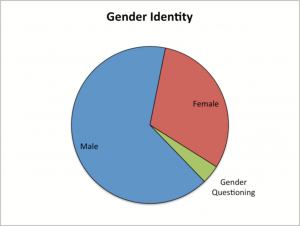
Our respondents were predominantly male, though many women and at least one gender questioning person responded.
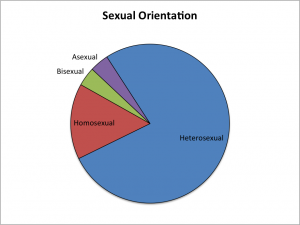
When it came to sexual identity, our over two thirds of our respondents identified as heterosexual, while a third identified as homosexual, bisexual and asexual.
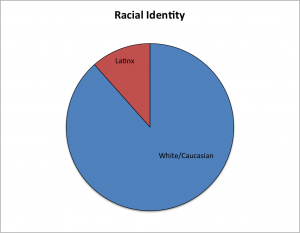
Unsurprisingly, most of our respondents were white, with a few identifying as Latinx.
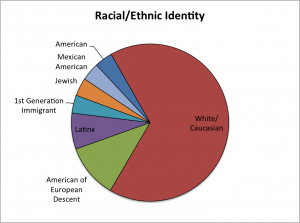
Our respondents’ ethnic identities showed more granular definition. This chart shows all instances of a self-identified ethnic or cultural identity.
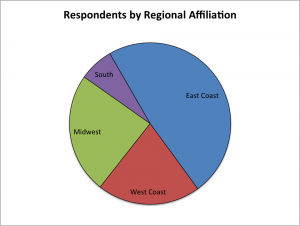
About half of our respondents work on the East Coast, while about a quarter each are based in the Midwest or on the West Coast and a few in the South. There is some overlap here, as some designers work in multiple regions.
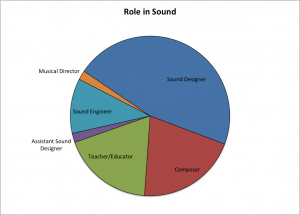
This chart includes all the answers from our respondents. Many people listed multiple job roles, so represented here is the full breadth of possible jobs our members listed in their answers.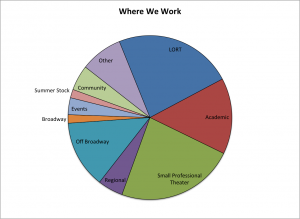
Lastly a breakdown of all the different kinds of theaters the respondents work in. There’s been some aggregation into larger categories to make the chart easier to read.
Next we will be looking at the short answer responses concerning diversity and inclusion in our field. Our respondents’ were very gracious in taking the time to give wonderfully reflective answers that we look forward to sharing with you.